Today’s Digital Future Summit 2.0 saw the launch of The National Broadband Map, built with ProjectX technology. Its purpose is to help improve access to broadband, especially in the regions, through “demand aggregation”: pooling the demand for telecommunications services in a specific geographic location.
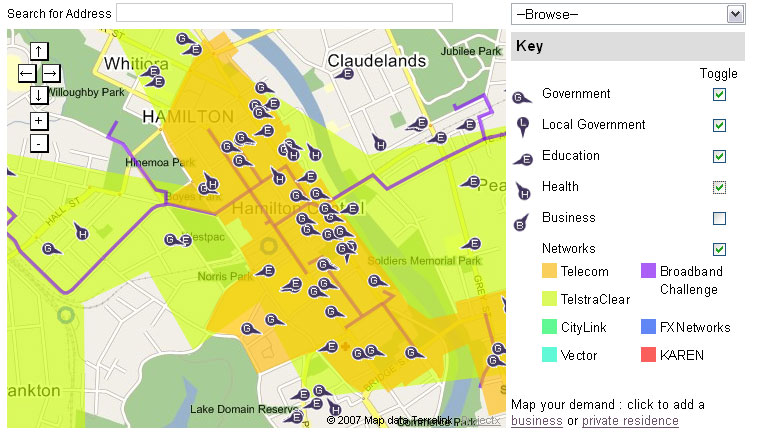
Individual users might find it hard to convince a telco to roll out services in their area, but when those users combine, they can often reach the critical mass required to attract investment in the provision of new services. For instance, if you’re a graphic design business in a small provincial town, you might struggle to convince a provider to extend their infrastructure to reach you; but if there is also a school, medical centre and library down your street, plus several other businesses and private residents who are also interested, then the telcos might sit up and take notice.
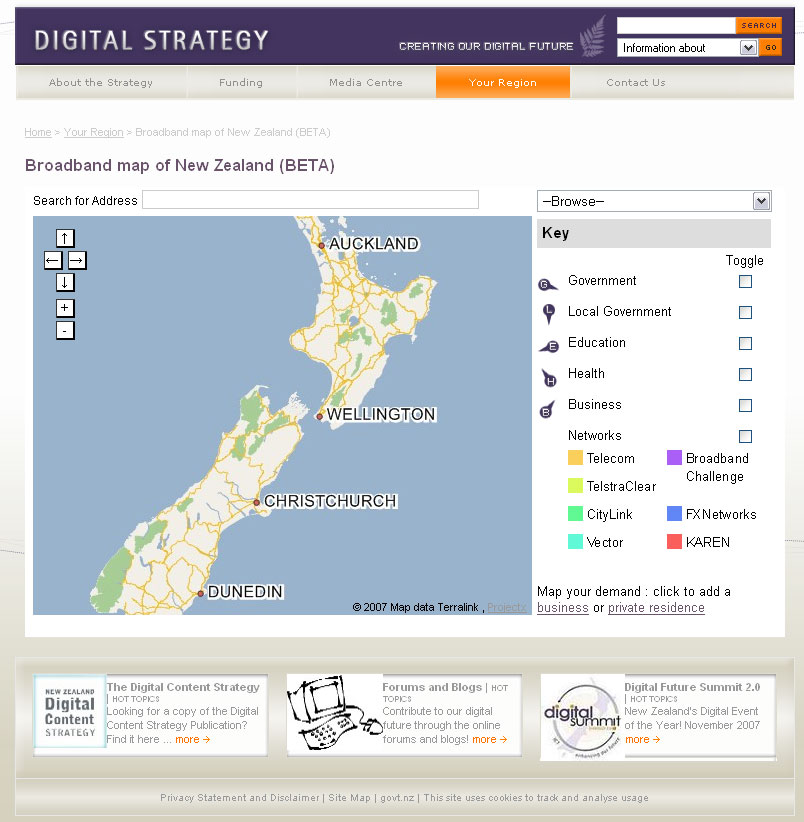
To this end, the map shows existing state sector locations, as well as allowing businesses and private residences to enter their own locations and describe their level of demand. It also shows existing network infrastructure, and includes all the address search, autocomplete, zooming and panning functionality that is familiar to ZoomIn users.
The system was developed by ProjectX together with the State Services Commission, and involved the collation, geocoding and checking of thousands of state sector locations, and the conversion of network data from all sorts of formats and projections, as well as building on existing ZoomIn Mapping System API functionality. For instance, the ZMS has always had the ability to display vector layers (polylines and polygons) as overlays on the maps, but the size and complexity of the network infrastructures required some hard work from our developers to optimise the performance of these layers, as well as dealing with the inevitable curly cross-browser compatibility issues.
In keeping with the Web 2.0 theme, the Map is labelled “Beta”, and it will evolve over time. Partly that will be due to the growing information base, from user-added places and as we receive more state sector locations and existing network data. There will also be functionality and usability improvements over time, and we encourage user feedback so that we can make this as comprehensive and easy-to-use as possible.
