Archive for the ‘Speed Up NZ Internet’ Category

Full results – Home page hall of shame Dec 2010

Sunday, December 19th, 2010

Introduction

This is the latest installment of the “Home page hall of Shame” which is an independent audit of the state of Web Page Optimisation in New Zealand. This test takes the top 100 New Zealand based websites from Alexa rankings and compares a number of different metrics – Page Size, Download time, optimisation scores and Javascript optimisation.

Summary

  • The homepages for 100 of the top NZ based websites was measured using  webpagetest.org.nz on 1.5Mb DSL connection Thanks to aptimize.com.
  • The average page size of homepages was 554.6K Up from (359.6K in May 2009 & 305.1K in 2008)
  • Fastest home pages load < 2 sec. Top site loads in 1.46 secs ! The average download time was 9 secs using broadband connection. And average 4.6 seconds for a cached reload.
  • 62% of websites use  WEB COMPRESSION
  • The largest pages were over 2000K. The largest site was 4.6M and had images that were more than 1Mb.
  • A lot Advertising javascript still is not being compressed
  • Some sites have dozens of Javascript and CSS files, worst offender had 34 javascript files.
  • The fastest sites have less total requests. There seems to be a strong co-relation to lower total requests to speed.

Percent of sites that got a passing grade for the basic optimization checks:

Optimization Percent of pages with a passing grade (2010)
Keep-alive Enabled 87%
Compress Text 62.5%
Compress Images 59.5%
Cache Static Content 53.5%
Combine JS/CSS 19%

Download time distribution


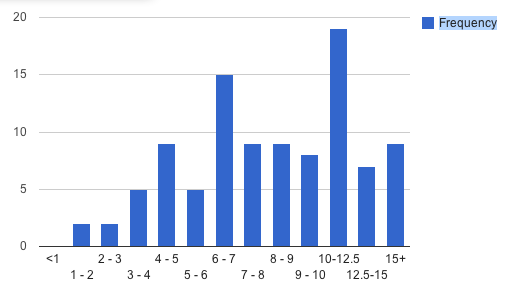
Table 1 – Shows the distribution of download times of the top 100 home pages.

This

Time Frequency
<1 0
1 – 2 2
2 – 3 2
3 – 4 5
4 – 5 9
5 – 6 5
6 – 7 15
7 – 8 9
8 – 9 9
9 – 10 8
10-12.5 19
12.5-15 7
15+ 9

What should we do to improve

The Data

Optimisation

What? This table shows the top ranking home pages with highest optimisation scores as ranked by performance ranking tools YSlow and Pagespeed.

How? We used the website www.showslow.com to record the score for the test.

Why is this important? This result shows which sites are best optimised for web performance. The sites  are optimised sites for fastest downloading and reloading of pages.

Top 10 most optimised sites

Site YSlow Rating Page speed Combined Score
radionz.co.nz 89 91 180
geonet.org.nz 92 87 179
snipesoft.net.nz 91 87 178
www.school.nz 90 87 177
zoomin.co.nz 86 89 175
gpstore.co.nz | mightyape.co.nz 85 88 173
findsomeone.co.nz 85 87 172
oldfriends.co.nz 86 85 171
otago.ac.nz 88 83 171
geekzone.co.nz 79 90 169

Top 10 worst optimised sites

Site YSlow Rating Page speed Combined Score
golf.co.nz 63 66 129
psis.co.nz 53 76 129
kiwibank.co.nz 61 69 130
sjs.co.nz 65 70 135
nbr.co.nz 65 70 135
consumer.org.nz 72 63 135
stuff.co.nz 63 73 136
whaleoil.co.nz 64 73 137
wises.co.nz 68 70 138
skycitycinemas.co.nz | event cinemas 68 71 139

Download time

What? This table shows the top ranking home pages with fastest and slowest download times .

How? We used the website webpagetest.org website on 1.5Mb DSL connection Broadband in Wellington NZ to simulate a fair test of all the webpages. The test took page over the weekend 4th and 5th of December. *** (The ird.govt.nz site was re-tested on the 8th of December after they improved their download size from >2Mb)

Why is this important? This result shows which sites are fastest to load for users. The faster the website, the more pages that a user can visit in the allotted time.

Top 10 fastest home page download speed (Broadband)

Site Size (K) Total requests Webpagetest.org first load time
– Broadband (secs)
geonet.org.nz 52.2 21 1.695
newzealandgirls.co.nz 59.5 26 1.7
oldfriends.co.nz 71.6 24 2.14
psis.co.nz 122.2 14 2.798
auckland.ac.nz 126.5 26 3.07
www.school.nz 49.5 6 3.17
canterbury.ac.nz 205.8 26 3.2
snipesoft.net.nz 117.1 12 3.54
immigration.govt.nz 148.7 26 3.76
westpac.co.nz 194.3 33 4.12
telecom.co.nz 345.8 27 4.3

Top 10 slowest home page download speed (Broadband)

Site Size (K) Total requests Webpagetest.org time first load time
– Broadband (secs)
thestandard.org.nz 4302 85 35.5
whaleoil.co.nz 1214 88 29.6
publicaddress.net 2429 40 20.664
vouchermate.co.nz 954.7 93 20
waikato.ac.nz 201.7 48 19.07
scoop.co.nz 288.3 60 17.3
skycitycinemas.co.nz | event cinemas 1023.7 116 16.3
kiwibank.co.nz 1468 59 15.6
kiwibiker.co.nz 419.9 77 15.3
tvnzondemand.co.nz 666.1 92 15.0

Size

What? This table shows the largest and smallest home pages by total download size .

How? We used YSlow to provide the tool download size of the home page including all the HTML , Javascript, CSS, image and Flash files.

Why is this important? This highlights the total size of some of the home page. Some of these webpages sizes are out of control and webmaster need to think about the time that it takes to load their sites.

Top 10 largest home pages by size

Site Size (K) Total requests
thestandard.org.nz 4302 85
publicaddress.net *** 2429 40
kiwibank.co.nz 1468 59
menumania.co.nz 1368.5 62
whaleoil.co.nz 1214 88
skytv.co.nz 1148 139
golf.co.nz 1119.2 92
nzherald.co.nz 1048.7 119
skycitycinemas.co.nz | event cinemas 1023.7 116
sella.co.nz 1008.9 71

*** 20/10 Public address have optimised their images and now the home page is 806K. Awesome work guys !

Top 10 smallest home pages by size

Site Size (K) Total requests
www.school.nz 49.5 6
geonet.org.nz 52.2 21
oldfriends.co.nz 71.6 24
vodafone.co.nz 97.9 67
zeald.com 110.8 47
snipesoft.net.nz 117.1 12
psis.co.nz 122.2 14
yellow.co.nz 124 48
auckland.ac.nz 126.5 26
radionz.co.nz 133.8 26

Cacheability

What? This table shows which sites have the fastest reload time. ie. this is the 2nd loading of a site after an initial load.  This is an indication of effective are the cacheability of the webpage.

How? We used the website webpagetest.org website on 1.5Mb DSL connection Broadband in Wellington NZ to simulate a fair test of all the webpages. The test took page over the weekend 4th and 5th of December.

Why is this important? This test shows which sites will load fastest for regular users. A cacheable site will load quickly as the browser does not have to reload all the content that hasn’t change (static content)

Top 10 fastest cached pages – 2nd reload of a page

Site Size (K) Total requests Webpagetest.org time first load – Broadband (secs) Cached load – Broadband (secs)
geonet.org.nz 52.2 21 1.695 0.037
aut.ac.nz 581.4 63 9.1 0.146
otago.ac.nz 215.8 31 5.216 0.44
snipesoft.net.nz 117.1 12 3.54 0.53
newzealandgirls.co.nz 526.5 26 1.7 0.585
finda.co.nz 426.8 51 8.2 0.896
westpac.co.nz 194.3 33 4.12 0.998
radionz.co.nz 133.8 26 7.4 1.007
gpstore.co.nz | mightyape.co.nz 725.4 83 7.165 1.253
slingshot.co.nz 459.2 105 6.12 1.28

Javascript

What? This table shows which sites have most javascript files on the home page.

How? We used YSlow to provide the number of the javascript files used on the web page.

Why is this important? Javascript files can be bad for your website if they are not properly optimised and loaded in the correct way. The scripts can be block the downloading of any other content on the webpage.  The more javascript files on the site can make the page very slow while the user has to wait until the browsers loads all the javascript then continues to render the page.

Top 10 home pages with most javascript files

Site Size (K) Total requests # of Javascript Files Webpagetest.org time first load- Broadband (secs)
kiwiblog.co.nz 838.1 108 34 14.7
tvnzondemand.co.nz 666.1 92 32 15
ticketek.co.nz 837 115 30 14.046
aa.co.nz 669.2 97 29 10.994
golf.co.nz 1119.2 92 27 13.468
tvnz.co.nz 635.4 110 26 13.01
nbr.co.nz 675.5 66 23 7.7
thestandard.org.nz 4302 85 23 35.5
kiwibank.co.nz 1468 59 21 15.6
eventfinder.co.nz 699.8 111 21 10.142

Summary of Homepage Hall of Shame – Dec 2010

Sunday, December 5th, 2010

I’ve been inspired by Pat Meenan’s excellent posts of the State of optimization summary and the state of web performance optimization 2010 , so I thought I’d do another “Homepage hall of shame“. – which is a web performance review of the top 100 NZ based websites. (Top 100 sites is based on Alexa traffic).

I’ll post the full report soon, here are some of the findings…

Summary Findings

  • The homepages for 100 of the top NZ based websites was measured using  webpagetest.org.nz on 1.5Mb DSL connection Thanks to aptimize.com.
  • The average page size of homepages was 554.6K Up from (359.6K in May 2009 & 305.1K in 2008)
  • Fastest home pages load < 2 sec. Top site loads in 1.46 secs ! The average download time was 9 secs using broadband connection. And average 4.6 seconds for a cached reload.
  • 62% of websites use  WEB COMPRESSION
  • The largest pages were over 2000K. The largest site was 4.6M and had images that were more than 1Mb.
  • A lot Advertising javascript still is not being compressed
  • Some sites have dozens of Javascript and CSS files, worst offender had 34 javascript files.
  • The fastest sites have less total requests. There seems to be a strong co-relation to lower total requests to speed.
  • There are two main things that websites should do speed up their sites. 1) Properly Set cache expiry 2) Javascript + CSS bundling.

Percent of sites that got a passing grade for the basic optimization checks:

Optimization Percent of pages with a passing grade (2010)
Keep-alive Enabled 87%
Compress Text 62.5%
Compress Images 59.5%
Cache Static Content 53.5%
Combine JS/CSS 19%

**Note: I’ve removed the CDN measurement as very few NZ sites use a CDN.

For more web optimisation comparison check out the Home Page drag race.

Home page Drag Race

Wednesday, December 1st, 2010

I’ve created a set of video’s highlighting the page load time differences of a selection of NZ top websites.

side edffects of prednisone

Its a drag race, lets see who can claim bragging rights????

Notes:

  • The videos show download times from the US using a “broadband” IE 7.
  • The page load times in NZ are faster, but this gives you an idea of which sites are faster.
  • Sites are finished loading when they turn gray.
  • The latency of connection from the US plays havoc with advertising page components causing some pages to take longer to complete.
  • The page rendering of dynamic components also seems to load slowly.
  • All the videos are made using the visual comparison on webpagetest.org.

News sites

  • Winner: Scoop 13.5 seconds
  • First readable page: Stuff 4.3 seconds.
  • Slowest page: Stuff 40.5 seconds * Due to javascript delays

Banking

  • Winner: ANZ – 12.9 seconds
  • First readable page: ASB – 5.0 seconds
  • Slowest page: Kiwibank – 30 seconds * Due to flash animation ?

Mobile carriers

  • Winner: Telecom – 7.7 seconds
  • First readable page: Telecom – 5.0 seconds
  • Slowest page: Two Degrees – 21.8 seconds

Auction sites

  • Winner: Trade Me – 10.4 seconds
  • First readable page: Trade Me – 3.5 seconds
  • Slowest page: Sella – 10.5 seconds

New Year wishes for the mobile web

Sunday, January 10th, 2010

I spent a bit of time over the Xmas break using the iPhone for reading webpages. I’m hooked on using Google FastFlip as a way to flick through the top blogs and news sites like Techcrunch, ReadWriteWeb, VentureBeat and BBC News. Unfortunately, I discovered how really sucky browsing webpages from a mobile device is. I’m not sure what the percentage of mobile browsers on visiting site is like for the blog / news site, but I’m sure that its growing audience and the experience is far from ideal at the moment.

I’ve come up with a list of wishes that I would like for see get nailed over this year. (These suggestions are not just for iPhone but for all mobile web devices)

1) Automagic website layout engine for mobile web

A couple weeks ago, I discovered Readability, the page re-formating tool that can dynamically format webpages via a javascript bookmarklet (thanks to Lance Wiggs for the link). It was a revelation. Readability removes the clutter and distractions from the a page to just give you a page designed for reading.

Readability is designed for a normal browser not the iPhone. I did a bit of digging and found that someone has found out how to get it working on iPhone – How to get Readability on iPhone

It requires a little bit of yak shaving to get it working. (I promise only a bit of cut and pasting) So far it’s working on 99% of the pages I’ve looked at it and its a lot nicer to us.

The only downside is that I have to load the original page before switching to the Readability template.

Here’s how it looks on iPhone


Original Page

Original Page with zooming


Page with Readability applied

Readability works so well on iPhone that it got me thinking…. Surely there is a way to create a javascript library that would be able to re-format a webpage to work on a mobile device automatically. And it would be able to take into account more simplified navigational and advertising components. So then anyone with a blog can install the javascript and css on their site and be “mobile” ready. This give the content owners control over how their content is going to be viewed. Otherwise, we’ll move the content until we can see what we want.

Wish 1 – A Plugin for styling webpages for Mobile content – I’m sure that there are some clever jQuery hackers that can take the Readability approach and create a javascript library to detect and mobile device and re-factor the layout automagically.

UPDATE: It looks like Instapaper does a lot of what I want – its a mix of Delicious and Readability in that it allows you to download pages on the iPhone to read them offline and it has a mobile template for reading. Looks interesting.

2) Speed and Page Size for website.

Web pages have to be optimised for mobile devices!

I have “grazing” browser behaviour on phone that means I’m sample small bits from a number of pages. S0 I will leave open pages in the browser and re-open them after switching in and around different apps. What I have noticed is that majority of webpages have to completely reload AGAIN. The iPhone doesn’t cache any web objects (html, css , js and images ) over 15K ! (It used to cache 25K but testing has shown that its only caching 15K objects. )

Blog / news pages are often from 100 – 500K. On 3G, the page loading speed is painful. Webpages need to be optimised for web device. I’m not so worried about wasting bandwidth, more so that if its loads slowly, I’ll switch to something else. The iPhone has allowed me to consume the web in byte sized chunks, I want to quick graze not “queue” up for pages.

Optimisation tools that create packaging of CSS / Javascript and Image Spriting will need to have “mobile” settings to take into account of the mobile cache limitations.

iPhone Browsing tip from iPhone caching article

“Tapping the reload icon in the address bar sends unconditional requests for all components, without the If-Modified-Since header and ignoring the Expires header. So to speed up your browsing, refresh the page by tapping the address bar and then tapping GO, don’t use the refresh icon.

Wish 2Standards for the webpages for the mobile web. Mobile pages needs to smaller, more focused. The overall page size including ads should only be around 80-100K. Individual components should be less than 15K. Optimisation tools should have output modes – normal and mobile.

3) Merge Fast Flip + Google Reader


Please Google can you integrate Google Reader and Fast Flip. It would make the killer blog reader on iPhone. I use Fast flip all the time. The sheer volume of some of the blogs like techcrunch is far too much for me to handle and as such I normally ignore it. Using fastflip has allowed me to quickly skim over the articles and drill in and read the ones I’m interested in. I’ve found it a great tool for my blog reading, but I have some requests….

  • Wish 3.1 Use the FastFlip engine on all my feeds from Google Reader.
  • Wish 3.2 Give me the option to only see that pages that I haven’t seen before (not necessarily the one’s that I haven’t read)

UPDATE: Fast Flip is now been integrated into Google News via Fast Company (12/2/10)

The mobile web is getting pretty exciting especially with tools like jQTouch making it easy to make customised UI for mobile sites. We’re going to spend more time on our mobile device, website owners need to optimise our experience to be a joy not a pain in the ass.

Global webpage test figures

Sunday, May 24th, 2009

Patrick Meenan of AOL has released aggregated data results of a years data of web page testing from webpagetest.org.

Here a quick summary of the results:

Average Load Time: 10.1 seconds
Average Time to First Byte: 1.1 seconds
Average Time to Start Render: 3.8 seconds

Average Page Size: 510 KB
Average Number of Requests: 50
Average Number of Redirects: 1

Comparing that to the web performance audit of the top 100 NZ websites.

Average homepage size: 359.6K
Average download time: 3.85
Average total requests: 57.2

Looks like NZ homepages are starting to get the message.

Homepage hall of shame – 1 year on….

Tuesday, May 19th, 2009

I decided to have a look at “The NZ homepage hall of shame” , 1 year on. ( Part of the speeding up NZ Internet series, I’ve just finished retesting the web performance of top 75 NZ homepages and added another 25 websites to cover the departure of a few sites) .

This time around, I’ve added a couple new metrics, including website download time. I’ve used Webpagetest.org.nz to calculate download time. The webpagetest service is equivalent download speed to a fast office connection. (ie. they have 15Mb Down 1Mb Up connection !)

The bragging rights for NZ’s fastest webpage does not belong to Trade Me but to Land Transport at #1 and Canterbury University at #2. (Although Trade Me dominate the Top 10).

The key takeaway from this audit is the effect of too many page elements will kill download speed. Reducing the number of page elements will speed up the site!

Summary Findings

  • The average page size of homepages was 359.6K. ( Up from 305.1K)
  • Fastest sites load < 1 sec. Top site loads in 0.246 secs ! The average download time was 3.85 secs
  • 33% of websites use NO WEB COMPRESSION (Down from 52% – Great improvement)
  • The largest pages were over 1000K
  • A lot Advertising javascript still is not being compressed
  • Some sites have dozens of Javascript and CSS files, worst offender had 35 javascript files
  • The fastest sites have less total requests. There seems to be a strong co-relation to lower total requests to speed.

Here are the summary results: (The raw results are found here – http://spreadsheets.google.com/pub?key=p94gU-OKvrDhp7ggKO8iiBw )

.

Fastest Homepage

.

Site Rating Size (K) Total requests Homepage Size backend percentage Webpagetest.org.nz time first load webpagetest.org.nz Cached load

.

landtransport.govt.nz 73 51.7 16 12 23.21% 0.246 0.237

.

canterbury.ac.nz 69 156.1 20 19 12.17% 0.563 0.508

.

findsomeone.co.nz 90 95.8 13 5.9 6.16% 0.678 0.453

.

oldfriends.co.nz 89 89.4 16 7.4 8.28% 0.77 0.544

.

psis.co.nz 69 118.2 17 7.4 6.26% 0.795 0.574

.

otago.ac.nz 79 107.2 15 6.8 6.34% 0.849 0.745

.

trademe.co.nz 57 225.3 84 17.7 7.86% 1.059 0.688

.

snipesoft.net.nz 78 100.3 14 2.7 2.69% 1.078 0.552

.

golf.co.nz 71 196.8 24 6.6 3.35% 1.129 0.542

.

massey.ac.nz 79 242.2 17 39.4 16.27% 1.193 0.867

.

westpac.co.nz 70 152.3 33 23.3 15.3% 1.275 0.239

.

.

Slowest homepages

.

Site Rating Size (K) Total requests Homepage Size backend percentage Webpagetest.org.nz time first load webpagetest.org.nz Cached load

.

clear.net.nz 59 326.8 100 45.6 13.95% 22.35 15.179

.

sjs.co.nz 60 261.2 51 18.9 7.24% 14.53 5.131

.

realenz.co.nz 57 531.1 81 7.2 1.36% 10.852 5.413

.

kiwibiker.co.nz 64 945.1 46 94.2 9.97% 10.792 6.904
d class=hd>

.

.

publicaddress.net 61 97.4 58 7.1 7.29% 9.769 7.226

.

ticketek.co.nz 51 633.8 110 12.1 1.91% 9.433 5.031

.

thestandard.org.nz 60 995.1 49 43.6 4.38% 8.526 3.541

.

vouchermate.co.nz 50 954.7 93 66.5 6.97% 8.319 3.588

.

telstraclear.co.nz 61 247.2 69 48.5 19.62% 7.776 2.006

.

odt.co.nz 53 557 104 26.5 4.76% 7.297 3.293

.

.

.

.

.

BEST YSLOW ranking

.

.

Site Rating Size (K) Total requests Homepage Size backend percentage Webpagetest.org.nz time first load webpagetest.org.nz Cached load

.

nz.yahoo.com 94 519.5 73 24.6 4.74% 5.819 3.447

.

findsomeone.co.nz 90 95.8 13 5.9 6.16% 0.678 0.453
oldfriends.co.nz 89 89.4 16 7.4 8.28% 0.77 0.544

.

zoomin.co.nz 86 291.1 84 7.9 2.71% 5.033 0.814

.

nzcity.co.nz 85 71 19 18.7 26.34% 2.743 1.529

.

nzdating.com 85 38.8 47 5.1 13.14% 3.804 1.977

.

airnewzealand.co.nz 84 150.6 57 6.3 4.18% 1.468 0.6

.

offtheback.co.nz 83 176.1 31 5.6 3.18% 2.576 0.681

.

massey.ac.nz 79 242.2 17 39.4 16.27% 1.193 0.867

.

gpstore.co.nz | mightyape.co.nz 79 255.7 106 12.9 5.04% 2.396 0.829

.

.

.

WORST YSLOW ranking

.

Site Rating Size (K) Total requests Homepage Size backend percentage Webpagetest.org.nz time first load webpagetest.org.nz Cached load

.

whaleoil.co.nz 49 541.9 88 94.1 17.36% 3.562 10.669

.

vouchermate.co.nz 50 954.7 93 66.5 6.97% 8.319 3.588

.

ticketek.co.nz 51 633.8 110 12.1 1.91% 9.433 5.031

.

asbbank.co.nz 52 548.8 108 5.8 1.06% 2.249 1.899

.

maxx.co.nz 53 535 71 51.2 9.57% 4.102 3.683

.

aa.co.nz 53 321.1 80 61.8 19.25% 2.695 1.593

.

odt.co.nz 53 557 104 26.5 4.76% 7.297 3.293

.

kiwiblog.co.nz 54 320.6 46 106.8 33.31% 7.133 3.27

.

skycitycinemas.co.nz 54 1103.8 72 17.1 1.55% 5.994 5.257

.

nbr.co.nz 54 491.4 66 9.6 1.95% 4.979 4.67

.

houseoftravel.co.nz 55 540 97 25 4.63% 2.284 1.773

.

.

Largest pages (K)

.

Site Rating Size (K) Total requests Homepage Size backend percentage Webpagetest.org.nz time first load webpagetest.org.nz Cached load

.

skycitycinemas.co.nz 54 1103.8 72 17.1 1.55% 5.994 5.257

.

kiwibank.co.nz 58 1061.9 34 23.1 2.18% 1.923 1.54

.

skytv.co.nz 55 1048.5 129 19.2 1.83% 4.586 2.916

.

thestandard.org.nz 60 995.1 49 43.6 4.38% 8.526 3.541

.

thewarehouse.co.nz 59 963.4 97 90.7 ass=’s12′>9.41% 3.849 1.397

.

vouchermate.co.nz 50 954.7 93 66.5 6.97% 8.319 3.588

.

kiwibiker.co.nz 64 945.1 46 94.2 9.97% 10.792 6.904

.

tvnz.co.nz 59 820 148 28.1 3.43% 3.878 2.536

.

orcon.net.nz 66 788.5 52 4.6 0.58% 2.697 1.41

.

aatravel.co.nz 55 685.5 79 16.2 2.36% 3.469 1.909

.

.

Smallest pages (K)

.

Site Rating Size (K) Total requests Homepage Size backend percentage Webpagetest.org.nz time first load webpagetest.org.nz Cached load

.

nzdating.com 85 38.8 47 5.1 13.14% 3.804 1.977

.

landtransport.govt.nz 73 51.7 16 12 23.21% 0.246 0.237

.

nzcity.co.nz 85 71 19 18.7 26.34% 2.743 1.529

.

te.co.nz 61 79 42 9.1 11.52% 2.349 2.349

.

oldfriends.co.nz 89 89.4 16 7.4 8.28% 0.77 0.544

.

findsomeone.co.nz 90 95.8 13 5.9 6.16% 0.678 0.453

.

publicaddress.net 61 97.4 58 7.1 7.29% 9.769 7.226

.

vodafone.co.nz 68 97.9 67 21.5 21.96% 2.148 1.674

.

snipesoft.net.nz 78 100.3 14 2.7 2.69% 1.078 0.552

.

auckland.ac.nz 67 100.7 30 6.5 6.45% 2.114 0.69

.

zeald.com 73 103.1 33 5.5 5.33% 2.381 1.008

.

.

.

.

Homepage download time Frequency

.

<1 6

.

1 – 2 18

.

2 – 3 28

.

3 – 4 16

.

4 – 5 7

.

5 – 6 12

.

6 – 7 1

.

7 – 8 4

.

8 – 9 2

.

9 – 10 2

.

10+ 4
>

.

.

.

.

.

.

.

.

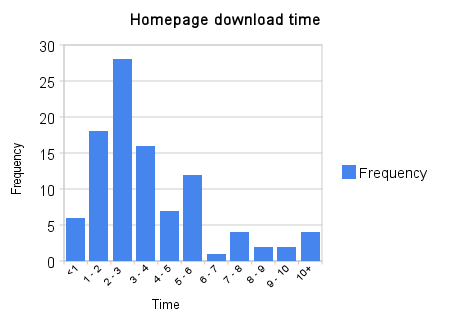
Here is a graph of the distribution of homepage download time.

homepage_download_time

Webpage test now in New Zealand

Tuesday, October 14th, 2008

The RPO team have released the AOL Webpagetest for New Zealand. Finally, we have a local content test frame work for testing the speed of a page.

Webpage Test is Awesome as it creates pageload waterfalls and average load times over a number of test iterations.


No there is no excuse for slow pages. Get to work NZ, we have a lot of internet to speed up !

Hammerhead – Measure pageload time in Firefox and export your findings to CSV

Wednesday, October 1st, 2008

A big day in the web optimisation space tool, we have a second new tool to help web developers in the quest for faster web pages. Mr YSlow Steve Sounders has just released a new tool – Hammerhead.

Here is Steve’s explanation behind the rational for the tool

* real user data – I love real user metrics. JavaScript frameworks like Jiffy measure page load times from real traffic. When your site is used by a large, diverse audience, data from real page views is ground-truth.
* bucket testing – When you’re getting ready to push a new release, if you’re lucky you can do bucket testing to gather performance metrics. You release the new code to a subset of users while maintaining another set of users on the old code (the “control”). If you sample your user population correctly and gather enough data, comparing the before and after timing information gives you a preview of the latency impact of your next release.
* synthetic or simulated testing – In some situations, it’s not possible to gather real user data. You might not have the infrastructure to do bucket testing and real user instrumentation. Your new build isn’t ready for release, but you still want to gauge where you are with regard to performance. Or perhaps you’re measuring your competitors’ performance. In these situations, the typical solution is to do scripted testing on some machine in your computer lab, or perhaps through a service like Keynote or Gomez.
* dev box – The first place performance testing happens (or should happen) is on the developer’s box. As she finishes her code changes, the developer can see if she made things better or worse. What was the impact of that JavaScript rewrite? What happens if I add another stylesheet, or split my images across two domains?

I’ve done a quick test of ZoomIn from our crimped broadband at home. And I can already see that we have some work to sort out page load time.


I’ve been after a tool that will measure page loadtime and exports out to a data file. A big thanks to Steve for the tool.

Awesome slide deck on Image Optimisation

Wednesday, July 2nd, 2008

Here’s another awesome slide deck from the Velocity conference – Image Optimisation, 7 mistakes and how to correct them (PPT) by Stoyan Stefanov.

In his audit he has found 45.6% of the total page download size of the top 10 websites homepages are images. Here is the list of 7 tips for improving image optimisation from the slides.

  1. Use PNG’s over GIF’s – The big sites (Yahoo / Google /Blogger / MySpace / Live.com etc) could save 20% image size by using PNG’s over GIF’s.
  2. Not crushing PNG’s – Default PNG setting are not the most optimal. Using pngcrush can reduce the size of PNG’s even more.
  3. Not stripping JPEG meta data – Jpeg contain lots of meta data including in some cases thumbnails of the image and audio inside the EXIF information. (Remember thumbnails should be 3-4K in size)  Strip out all non critcial exif information using tools like jpegtrans
  4. Use Palette PNG’s instead of True colour PNGs.
  5. Avoid AlphaImageLoader, try PNG8 or at least _filter
  6. Crush generated images – GD and Imagemagick don’t always do the best job in optmising images.
  7. Use CSS sprites!

Finally Stoyan says if you optimise your images you can save 10-30% of the download size.

NZ Government Home page web performance audit

Thursday, May 22nd, 2008

This part II of my audit of New Zealand Homepages (Part I looked at the top 75 homepages in New Zealand).

I have conduct an audit of 320 Government websites looking at their web performance. The audit was conducted by using YSlow to analyse the download performance of the homepage of a Government website. The list of government websites was taken from the New Zealand Government website. Full results are available from this Google Spreadsheet. Audit conducted on Tuesday Night 20th May 2008.

Audit Findings


Homepage Size

Graph of NZ Government Home page sizes

(Click on the graph to view values)

  • The average homepage size was 216.85K (Compared to 304.5K for top 75 NZ websites) The largest Homepage was staggering 2442K and the smallest homepage was 8.3K,

Web Compression

Graph of Web compression usage on Government webpages

  • 84.1% of Government homepages were not compressed, 11.6% are compressing some of the page elements and only 4.4% (14 sites) are fully compressing their pages.
  • Some sites are compressing only CSS and JS files but NOT their base HTML
  • A lot of sites have compression external javascript eg. Google Analytics (which was discounted as being part of the site) This highlights that all external javascript should be compressed.

Other findings

  • The worst site had 151 files for their homepage and the best site 3 files
  • The worst offending pages had over 21 Javscript files and the worst offender for the number of CSS files was 40.
  • Some sites have duplicate versions of scripts running. One site had 4 Google analytic scripts running.


Tables


Top 10 best Government homepages ranked by YSlow


Website Ranking Total Size (Kilobytes) Total Files # of Javascript files # of CSS files Etags Rating Web Compression Estimated Download time modem @6k/s
http://www.swrb.org.nz 92 23.3 3 0 0 C None 3.88
http://www.mstn.govt.nz 87 65.5 4 0 1 D None 10.92
http://www.nzaid.govt.nz/ 87 165.5 24 3 2 A YES 27.58
http://www.nzrefugeeappeals.govt.nz 87 18.1 4 0 1 D None 3.02
http://www.pco.parliament.govt.nz/ 87 32.7 4 0 1 D None 5.45
http://www.corrections.govt.nz 84 100.8 14 0 2 B None 16.80
http://www.paroleboard.govt.nz/ 82 32.9 9 2 3 A None 5.48
http://www.residencereviewboard.govt.nz 82 20.2 5 0 1 F None 3.37
http://www.gamblingcom.govt.nz/ 81 22.4 6 0 2 A None 3.73
http://www.cpit.ac.nz 80 32.7 5 1 0 A None 5.45


Top 10 worst Government homepages ranked by YSlow


Website Ranking Total Size (Kilobytes) Total Files # of Javascript files # of CSS files Etags Rating Web Compression Estimated Download time modem @6k/s
http://www.sparc.org.nz 31 420 77 21 15 F None 70.00
http://www.airforce.mil.nz/ 34 181.2 52 6 9 F None 30.20
http://www.med.govt.nz 35 298.8 88 3 40 F None 49.80
http://www.tauranga.govt.nz/ 35 393.6 46 16 12 F None 65.60
http://www.lincoln.ac.nz 37 172.4 42 4 14 F None 28.73
http://www.manukau.govt.nz 38 198.8 48 10 5 F None 33.13
http://www.northshorecity.govt.nz/ 38 310.2 47 13 5 F None 51.70
http://www.wintec.ac.nz 38 567.1 74 5 10 F None 94.52
http://www.hnzc.co.nz/ 39 147.8 69 9 16 A Some 24.63
http://www.tourisminfo.govt.nz/ 39 325.8 37 12 6 F None 54.30


Top 10 smallest Government homepages by size


Website Ranking Total Size (Kilobytes) Total Files # of Javascript files # of CSS files Etags Rating Web Compression Estimated Download time modem @6k/s
http://www.asure.co.nz 79 8.3 7 0 1 F None 1.38
http://www.nzrefugeeappeals.govt.nz 87 18.1 4 0 1 D None 3.02
http://www.residencereviewboard.govt.nz 82 20.2 5 0 1 F None 3.37
http://www.roadsafety.govt.nz 76 20.9 7 0 2 F None 3.48
http://www.gamblingcom.govt.nz/ 81 22.4 6 0 2 A None 3.73
http://www.swrb.org.nz 92 23.3 3 0 0 C None 3.88
http://www.takeovers.govt.nz 68 23.9 31 0 0 F None 3.98
http://www.cpit.ac.nz 80 32.7 5 1 0 A None 5.45
http://www.pco.parliament.govt.nz/ 87 32.7 4 0 1 D None 5.45
http://www.paroleboard.govt.nz/ 82 32.9 9 2 3 A None 5.48


Top 10 largest Government homepages by size


Website Ranking Total Size (Kilobytes) Total Files # of Javascript files # of CSS files Etags Rating Web Compression Estimated Download time modem @6k/s
http://www.taipoutini.ac.nz/taipoutini/ 63 2442 20 1 1 F None 407.00
http://www.maoritelevision.com/ 53 2353 44 3 5 F None 392.17
http://www.selwyn.govt.nz/ 64 1906 151 0 1 F None 317.67
http://www.kordiasolutions.com 56 1530 32 3 4 F Some 255.00
http://www.tematatini.org.nz/ 64 1209.6 12 2 1 F None 201.60
http://www.drugfreesport.org.nz/ 66 1009.7 40 4 2 A Some 168.28
http://www.horizons.govt.nz 55 971.3 42 1 2 F None 161.88
http://www.nzonair.govt.nz 66 886.2 68 2 2 F YES 147.70
http://www.transpower.co.nz/ 43 799.7 36 10 5 F None 133.28
http://www.hbrc.govt.nz 47 762.5 40 5 5 F None 127.08


http://www.canakkaleruhu.org http://www.vergimevzuati.org http://www.finansaldenetci.com http://www.securityweb.org http://www.siyamiozkan.org http://www.fatmaozkan.com http://www.sgk.biz.tr http://www.denetci.gen.tr http://www.bagimsizdenetim.biz.tr http://www.mevzuat.biz.tr http://www.security.biz.tr http://www.sorgulatr.com http://www.kanunlar.biz http://www.prsorgu.net http://www.sirabul.com http://www.emekliol.org http://www.coklupagerank.com http://www.coklupagerank.net http://www.coklupagerank.org http://www.prsorgu.org http://www.scriptencode.com http://www.sirabul.net http://www.sirabul.org http://www.sitenizanaliz.com http://www.seoisko.com http://www.seomavi.com http://www.scriptencode.net http://www.scriptencode.org