Homepage hall of shame – July 2011
Introduction
This is the latest installment of the “Home page hall of Shame” which is an independent audit of the state of Web Page Optimisation in New Zealand. This test takes the top 160 New Zealand based websites from Alexa rankings and compares a number of different metrics – Page Size, Download time, optimisation scores and Javascript optimisation.
Summary
- The homepages for 160 of the top NZ based websites was measured using webpagetest.org.nz on 1.5Mb DSL and 20Mb connection Thanks to aptimize.com.
- The average page size of homepages was 661.8K Up from (554.6K in Dec 2010 359.6K in May 2009 & 305.1K in 2008)
- Fastest home pages load < 2 sec. Top site loads in 1.1 secs !
- The average download time for office broadband – 5.98 secs(3.97 secs for page reload)
- The average download time for home broadband connection – 12.43 secs (5.21 secs for page reload)
- 66% of websites use WEB COMPRESSION
- Only 35% of sites load in under 4 seconds.
- The largest pages were over 4000K. The largest site was 4Mb and with one image over 3Mb.
- A lot Advertising javascript still is not being compressed
- Some sites have dozens of Javascript and CSS files, worst offender had 54 javascript files.
- The fastest sites have less total requests. There seems to be a strong co-relation to lower total requests to speed.
Percent of sites that got a passing grade for the basic optimization checks:
| Optimization | Percent of pages with a passing grade (2011) |
|---|---|
| Keep-alive Enabled | 89.4% |
| Compress Text | 61.55% |
| Cache Static | 31.4% |
| Compress Images | 66.4% |
Download time distribution – Office Broad band (20Mb)
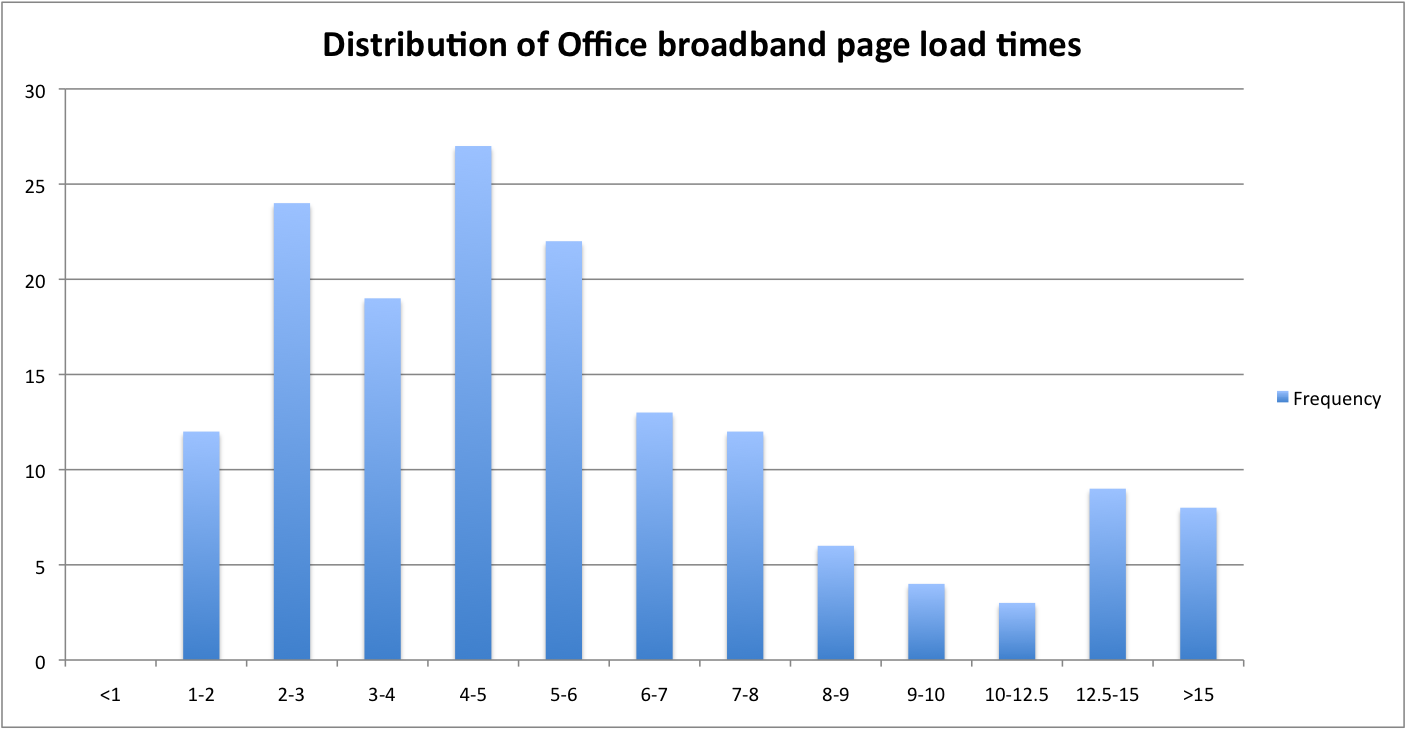
Table 1 – Shows the distribution of download times of the top 160 home pages using office broadband speed.
| Time | Frequency |
| <1 | 0 (0%) |
| 1 – 2 | 12 (7.55%) |
| 2 – 3 | 24 (15.09%) |
| 3 – 4 | 19 (11.95%) |
| 4 – 5 | 27 (16.98%) |
| 5 – 6 | 22 (13.84%) |
| 6 – 7 | 13 (8.18%) |
| 7 – 8 | 12 (7.55%) |
| 8 – 9 | 6 (3.77%) |
| 9 – 10 | 4 (2.52%) |
| 10-12.5 | 3 (1.89%) |
| 12.5-15 | 9 (5.66%) |
| 15+ | 8 (5.03%) |
Download time distribution – Home Broad band (1.5Mb)
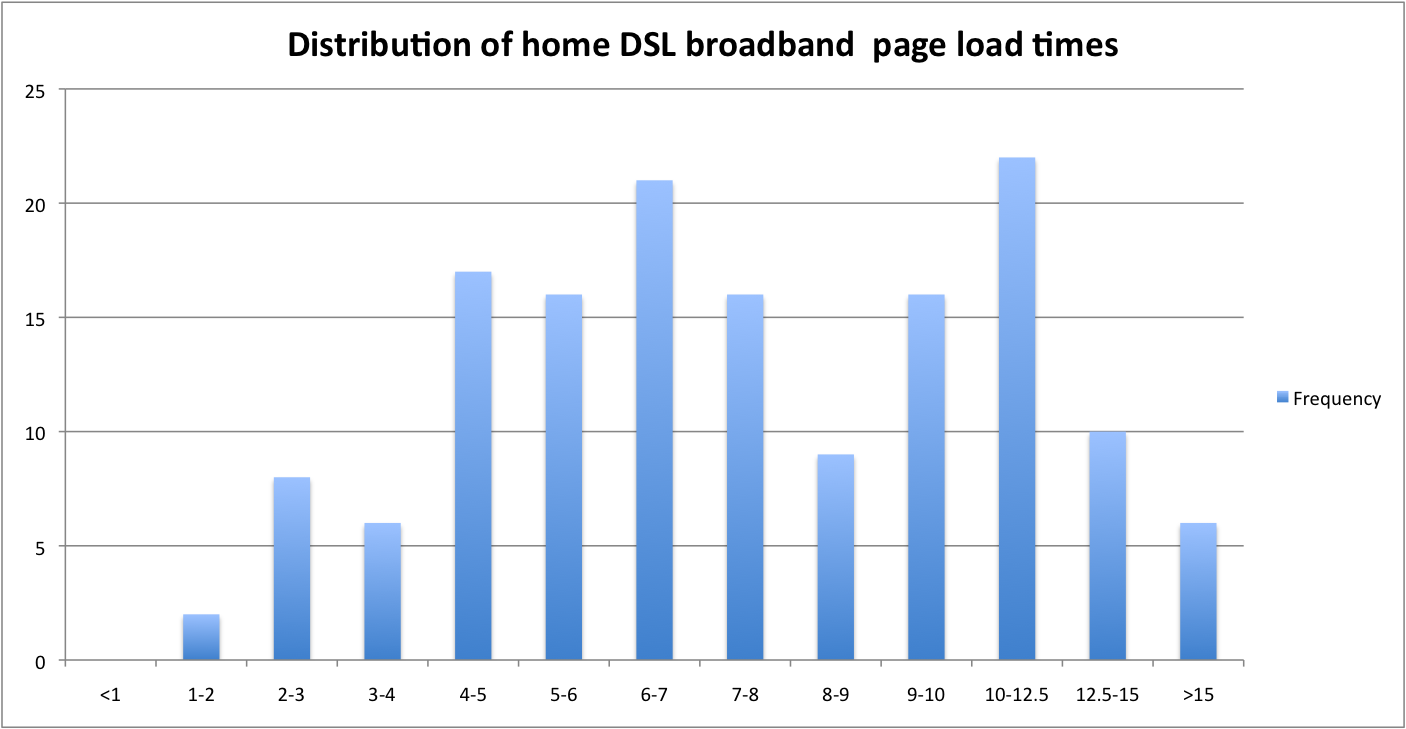
Table 1 – Shows the distribution of download times of the top 160 home pages using home broadband speed.
| Time | Frequency |
| <1 | 0 (0%) |
| 1 – 2 | 2 (1.26%) |
| 2 – 3 | 8 (5.03%) |
| 3 – 4 | 6 (3.77%) |
| 4 – 5 | 17 (10.69%) |
| 5 – 6 | 16 (10.06%) |
| 6 – 7 | 21 (13.71%) |
| 7 – 8 | 16 (10.06%) |
| 8 – 9 | 9 (5.66%) |
| 9 – 10 | 16 (10.06%) |
| 10-12.5 | 22 (13.84%) |
| 12.5-15 | 10 (6.29%) |
| 15+ | 6 (3.77%) |
What should we do to improve
The Data
Optimisation
What? This table shows the top ranking home pages with highest optimisation scores as ranked by performance ranking tools YSlow and Pagespeed.
How? We used the website www.showslow.com to record the score for the test.
Why is this important? This result shows which sites are best optimised for web performance. The sites are optimised sites for fastest downloading and reloading of pages.
Top 10 most optimised sites
| Site | YSlow Rating | Page speed | Combined Score |
| geekzone.co.nz | 95 | 98 | 193 |
| dashtickets.co.nz | 87 | 95 | 182 |
| snipesoft.net.nz | 91 | 90 | 181 |
| www.mightyape.co.nz | 84 | 96 | 180 |
| zenbu.co.nz | 92 | 86 | 178 |
| realestate.co.nz | 88 | 89 | 177 |
| xero.com | 84 | 92 | 176 |
| zoomin.co.nz | 87 | 88 | 175 |
| holidayhouses.co.nz | 83 | 92 | 175 |
| slingshot.co.nz | 76 | 93 | 173 |
Top 10 worst optimised sites
| Site | YSlow Rating | Page speed | Combined Score |
| Courier Post | 75 | 15 | 90 |
| smilecity.co.nz | 73 | 17 | 90 |
| yellowlocal.co.nz | 50 | 45 | 90 |
| metservice.co.nz | 63 | 38 | 101 |
| rcnz.co.nz | 80 | 25 | 105 |
| webjet.co.nz | 66 | 41 | 107 |
| ezibuy.co.nz | 71 | 37 | 108 |
| tvnz.co.nz | 71 | 37 | 108 |
| genesisenergy.co.nz | 68 | 61 | 109 |
| flightcentre.co.nz | 42 | 57 | 109 |
Download time
What? This table shows the top ranking home pages with fastest and slowest download times .
How? We used the website webpagetest.org website on 1.5Mb DSL connection Broadband and 20Mb Office network connection in Wellington NZ to simulate a fair test of all the webpages. The test took page over the week of the 2nd to 11th of July.
Why is this important? This result shows which sites are fastest to load for users. The faster the website, the more pages that a user can visit in the allotted time.
Top 10 fastest home page download speed using Office broadband
| Site | Size (K) | Total requests | Webpagetest.org first load time – Broadband (secs) |
| telecom.co.nz | 274.4K | 32 | 1.171s |
| dol.govt.nz | 121K | 21 | 1.234s |
| snipesoft.co.nz | 124K | 17 | 1.489s |
| auckland.ac.nz | 170K | 32 | 1.58s |
| massey.ac.nz | 401K | 37 | 1.596s |
| xenbu.co.nz | 31K | 13 | 1.623s |
| geonet.org.nz | 105K | 21 | 1.729s |
| school.nz | 52K | 7 | 1.731s |
| maxx.co.nz | 431K | 41 | 1.786s |
| westpac.co.nz | 385K | 20 | 1.874s |
Top 10 slowest home page download speed using Office Broadband
| Site | Size (K) | Total requests | Webpagetest.org time first load time – Broadband (secs) |
| skykiwi.com | 991K | 116 | 26.88s |
| thestandard.org.nz | 4076K | 92 | 20.917s |
| istars.co.nz | 3293K | 186 | 20.092s |
| whaleoil.gotcha.co.nz | 1765K | 151 | 17.199s |
| nz.yahoo.com | 828.1K | 105 | 16.491s |
| interest.co.nz | 410K | 55 | 16.381s |
| 3news.co.nz | 900K | 142 | 16.287s |
| thebigidea.co.nz | 1195K | 179 | 15.081s |
| readersdigest.co.nz | 1541K | 202 | 14.6s |
| stuff.co.nz | 1052K | 160 | 14.353s |
Size
What? This table shows the largest and smallest home pages by total download size .
How? We used YSlow to provide the tool download size of the home page including all the HTML , Javascript, CSS, image and Flash files.
Why is this important? This highlights the total size of some of the home page. Some of these webpages sizes are out of control and webmaster need to think about the time that it takes to load their sites.
Top 10 largest home pages by size
| Site | Size (K) | Total requests |
| thestandard.org.nz | 4076K | 92 |
| istars.co.nz | 3293K | 186 |
| stoppress.co.nz | 2141K | 140 |
| wahleoil.gotcha.co.nz | 1765K | 151 |
| yazoom.co.nz | 1762K | 216 |
| thewarehouse.co.nz | 1642K | 89 |
| barfoot.co.nz | 1610K | 68 |
| readersdigest.co.nz | 1541K | 202 |
| nzherald.co.nz | 1429K | 7.938 |
| eventcinemas.co.nz | 1396K | 110 |
Top 10 smallest home pages by size
| Site | Size (K) | Total requests |
| zenbu.co.nz | 31K | 13 |
| school.nz | 52K | 7 |
| elgar.govt.nz | 76K | 19 |
| oldfriends.co.nz | 83K | 28 |
| geonet.org.nz | 105K | 21 |
| dol.govt.nz | 121K | 21 |
| snipesoft.co.nz | 124K | 17 |
| radionz.co.nz | 130K | 23 |
| psis.co.nz | 133K | 15 |
| builderscrack.co.nz | 169K | 26 |
Cacheability
What? This table shows which sites have the fastest reload time. ie. this is the 2nd loading of a site after an initial load. This is an indication of effective are the cacheability of the webpage.
How? We used the website webpagetest.org website on 20Mb Office connection Broadband in Wellington NZ to simulate a fair test of all the webpages. The test took page over the week of 2nd to 11th of July.
Why is this important? This test shows which sites will load fastest for regular users. A cacheable site will load quickly as the browser does not have to reload all the content that hasn’t change (static content)
Note: There seems to be some problems with the reload calculation as geonet.org.nz and westpac.co.nz should be at the top of this table but for some reason they are not.
Top 10 fastest cached pages – 2nd reload of a page
| Site | Size (K) | Total requests | Webpagetest.org time first load – Broadband (secs) | Cached load – Broadband (secs) |
| oldfriends.co.nz | 83K | 28 | 1.971s | 0.822s |
| farmers.co.nz | 743K | 26 | 3.3s | 0.842s |
| zenbu.co.nz | 31K | 13 | 1.623s | 0.844s |
| snipesoft.net.nz | 124K | 17 | 1.489s | 0.866s |
| elgar.govt.nz | 76K | 19 | 4.838s | 0.929s |
| dol.govt.nz | 121K | 21 | 1.234s | 0.939s |
| aucklandcity.govt.nz | 176K | 28 | 5.355s | 1.018s |
| school.nz | 52K | 7 | 1.731s | 1.054s |
| nzqa.govt.nz | 604K | 32 | 2.108s | 1.1078s |
| dashtickets.co.nz | 502K | 31 | 2.51s | 1.103s |
Javascript
What? This table shows which sites have most javascript files on the home page.
How? We used YSlow to provide the number of the javascript files used on the web page.
Why is this important? Javascript files can be bad for your website if they are not properly optimised and loaded in the correct way. The scripts can be block the downloading of any other content on the webpage. The more javascript files on the site can make the page very slow while the user has to wait until the browsers loads all the javascript then continues to render the page.
Top 10 home pages with most javascript files
| Site | Size (K) | Total requests | # of Javascript Files | Webpagetest.org time first load- Broadband (secs) |
| whaleoil.gotcha.co.nz | 1765K | 151 | 54 | 17.199s |
| flightcentre.co.nz | 917K | 156 | 47 | 5.7s |
| readersdigest.co.nz | 1541K | 202 | 35 | 14.698s |
| thebigidea.co.nz | 1195K | 179 | 33 | 15.081s |
| vodafone.co.nz | 824K | 130 | 33 | 4.912s |
| yazoom.co.nz | 1762 | 216 | 32 | 7.931s |
| kiwblog.co.nz | 528K | 72 | 32 | 13.622s |
| tickettek.co.nz | 1022K | 146 | 30 | 13.267s |
| tvnz.co.nz | 832K | 72 | 32 | 5.929s |
| aatravel.co.nz | 870K | 114 | 29 | 5.892s |
July 16th, 2011 at 8:39 pm
John – I’m interested in why a site would rank a lot better for the 20Mb test than for the 1.5Mb test. I think we rank about 27th for first load at 20Mb, but dramatically worse for the 1.5Mb test.
cheers,
Rob
July 17th, 2011 at 10:31 pm
The answer lies in the speed of the network and effects of network latency. In your case there seems to be a problem with the webserver serving some of the requests very slow for the 1.5Mb test. Even if this didn’t happen you would rank mid-50’s.
Every request has a latency time from the time which the browser requests it and the time that the webserver starts to the serve the first byte. For 1.5Mb connection on average a latency of 100-120ms. There are cases your server waited upto 360ms to deliver 0.6K image (which took 0ms to deliver.
From what I can see your site can be twice at least fast with some optimisations!
July 18th, 2011 at 3:44 pm
I am interested on how you did your evaluation? I also use the same API as webpagetest.org and believe me the results varies with time. For example, you evaluated nz.yahoo.com as one of the slowest when most of the time, on a daily basis they get the fastest loading times.
I think it is unfair to judge these websites as slowest and not knowing what time of day they were evaluated. You see their are alot of factors that has to be consider when evaluating these websites and that includes the time of day they were evaluated. Considering on a particular period of time, some websites are overloaded on while at the sime period of time some website are not busy.
My question is did you measure these websites at the same time? Are they all tested on the same environment and of the same technical conditions?
July 18th, 2011 at 7:00 pm
Majority of the tests were run on the weekend using webpagetest.org. All of the test results in the Google have a URL with the full test details of every test.
I understand there are number of factors that can affect slow performance. In nz.yahoo.com case, the tests were run on a sunday. I was surprised that the result , so re-ran them several times. And the same result at different times of the day. (http://www.webpagetest.org/testlog.php?days=30&filter=nz.yahoo.com) There were poorly optimised advertising running that day contributed to the slowness.(http://www.webpagetest.org/result/110710_ZG_110R5/1/details/)
July 18th, 2011 at 7:08 pm
As for your “day job”. You got hammered by poor perforamnce by your ad partners.Put pressure on your ad partners to improve their performance.