Archive for July, 2007

What to commit a crime?? Just look up how to do it on Google…

Wednesday, July 11th, 2007

A couple of amateur safe crackers in Colarado Springs were struggling to find out how to open the safe of a business, so they used one of the office computers to find out how to crack the safe.

The burglary at Bigg City, formerly Mr. Bigg’s Family Fun Center, turned into a comedy of errors early June 10. The burglars tried to disable a security camera by repeatedly spraying it with WD-40 — it only cleaned the lens — and spent an hour and 15 minutes trying to open three safes, apparently unaware that some types require the dial to be turned two or three times.

They finally did a Google search for “how to open a safe” and “how to crack a safe” on a computer in the next room.

“They’re not professional safe people,” said Colorado Springs police detective Chuck Ackerman. “No, they’re not.”

On the other hand, the Google query apparently worked: The burglars haven’t been caught, and they did get about $12,000.

Full report ….

Classic!

What we've been upto…

Wednesday, July 11th, 2007

job1.jpgjob2.jpg


We’ve been a bit quiet on what we’ve been doing, so here’s a run down on what we’ve been working on over the last few months.

  • US Maps: We been building and rendering maps for North America (USA and Canada) for one of our clients. We’ve designed and rendered a large part of the US using mapserver and Teleatlas data. After maxing out 8 machines and some serious RAID kit, we’ve clocked over 10K CPU hours on the project so far and got a way to go yet.
  • NZ maps: We been working on updates and upgrades to the NZ maps.
  • New API: We’ve just in the final testing for a new API to compliment our mapping and geocoding API’s.
  • Demo websites: We’ve been working on a new map concept with a couple of Wellington companies.
  • New tools: We have a bunch of tools exiting the R&D phase entering production development. More info on those later.
  • Oh yeah, and we’ve been planning Summer of Code 2.0.

So what’s with all the secrecy???? We want to get a bit of a headstart before Wises and et start copying us again! 🙂

The 80:20 rule for SOA

Monday, July 9th, 2007

There is a really good post from ZDNet suggests that the 80:20 rule of software development needs to be changed for SOA (Services Oriented Architecture).

Here’s a snippet from the article.

At first the amount of needed customization is high — maybe 80 percent (a perversion of the old rule) — either because there are not many services available, or because the services are too general and not specific to a specialized vertical industry or niche function.

Then, over time, with investment, the balance shifts toward the 50-50 point, and reuse forms a majority of a composite applications or business process, even for highly specialized applications. These composited functions then become business-focused service frameworks, to then be reused and adjusted. Those architects that gain experience within business niches and verticals to create such frameworks can make significant reuse of the services.

Here's another use for your iPhone…

Saturday, July 7th, 2007

Google have released an open source app called telekinesis to convert an iPhone into a remote controller for your mac.

Now you can use your iPhone for :

* Stream music and videos from your computer (0.9.8) learn how
* Screen capture with mouse click and basic typing support
* Simple iTunes Remote control
* Browse your files
* Run applescript remotely
* iSight image capture
* Easily create and add more apps

Hey Rod, now you can use your ordered iPhone for more than use listening to music and browsing Xero 😉

Article on 5 ways to optimise Rails AJAX

Thursday, July 5th, 2007

Here’s a good post from the Vitamin site on 5 ways to optimise in  AJAX for Ruby on Rails.

Enjoy.

Three in one

Tuesday, July 3rd, 2007

One of the things that we’re always trying to do with data visualisation is show more variables, while trying at the same time not to clutter the map and overwhelm the viewer. When trying to show more than one variable across a map, it rapidly becomes impossible to grasp the information in one go. Edward Tufte, on page 153 of his classic book “The Visual Display of Quantitative Information”, describes one such attempt to map two variables through interaction of two colour schemes as “a puzzle graphic”, “experienced verbally, not visually”.

But that doesn’t mean that it’s not worth the effort. The distribution and interaction of two variables across a region is inherently complex, and to expect every nuance to immediately leap out at a viewer without reflection and complex analysis is unrealistic. My experience of reading professional weather maps that show multiple overlapping contours (e.g. of pressure and temperature) leads me to believe that any multivariate geographical visualisation will require some practice to get the most out of: to learn that where the isobars and isotherms are perpendicular, thermal advection is occurring.

If two variables are too much for Tufte, then the map below would appal him: I’m experimenting with showing three census variables at once on a map of central Wellington. I’ve mapped residential population density to the red channel, density of office workers to the blue channel, and density of other workers (e.g. manufacturing, retail) to green.
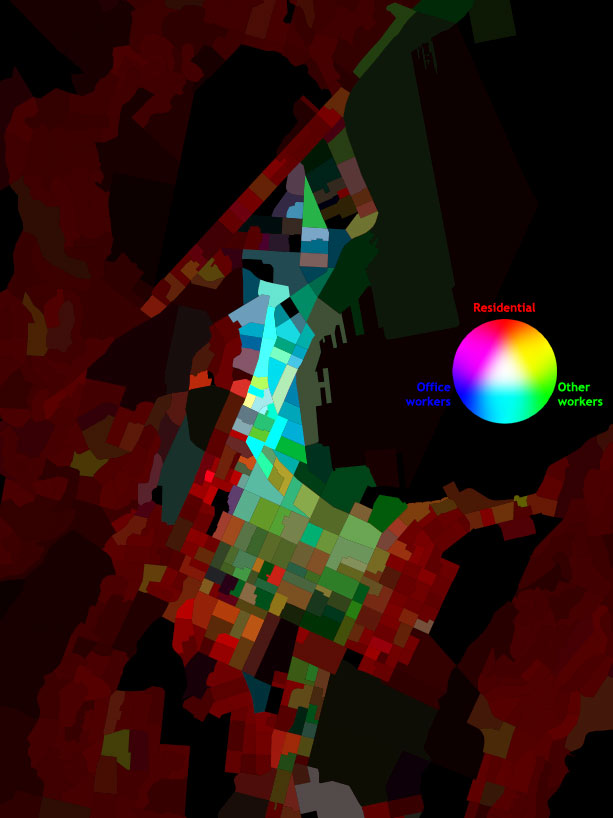
Trivariate mosaic visualisation - Central Wellington

It’s certainly complicated! But nevertheless, certain patterns do immediately leap out, and the more I look, the more I see. Purely residential neighbourhoods are quite distinctive in shades of pure red, and variations of population density can be seen quite clearly. The CBD stands out very plainly, but on second glance there’s also a difference between the Lambton Quarter and Thorndon: the cyans of the former show that office workers are balanced by others (probably retail), whereas the latter is much more of an office ghetto. Te Aro is quite a patchwork of greens and earthy tones, showing that a growing residential population is starting to complement the retail, entertainment and tradition light industrial uses of that part of town.

So, while bearing in mind Tufte’s warnings, I think that this sort of trivariate thematic mapping might have a lot to offer. In particular:

  • High data density: three separate variables across densely measured meshblocks.
  • Emergent patterns: without having to explicitly code “mixed use districts” or “CBDs”, they emerge from the interaction of two or more variables.
  • A meaningful grid: census meshblocks are mostly based upon city blocks, so variations in urban form, such as the grid pattern of Te Aro versus the curvy hill suburbs, are easily visible. The familiar forms (at least to locals!) of the wharves guide the eye without explicit use of contextual layers.
  • Exploiting human visual processes. While I’d concede Tufte’s point that one has to consciously remind oneself of what certain colours mean, the fact that the RGB system has a neural reality makes it easier than a more arbitrary system would have done.
  • Metaphorical power: I deliberately chose to make light colours represent high density and black represent an absence of people, which is the inverse of the usual approach. That gives a map full of neon colours, evocative of “city lights”, and fits with my own preference for dense and vibrant cities. It also brings to mind a mosaic, with its connotations of colourful diversity. As always, symbology reveals ideology!
  • Visual appeal. Well, at least I like to think it looks good! While it wasn’t deliberate or expected, I think it’s ended up quite reminiscent of early Paul Klee.
  • Depth of exploration. While the two previous points may seem relatively trivial, a map that is attractive and evocative is more likely to bring people back to explore further than an ugly or dull map would. Every time I look, I keep finding more patterns and intriguing anomalies, and it keeps raising new questions to ask of the data.
Great entrepreneurs show up, take small risks, and raise their hand…

Tuesday, July 3rd, 2007

Joel Sposky has a post talking about a few books. He singles out a quote from Ben Casnocha’s book called My Start-Up Life.

Great entrepreneurs show up, take small risks (and sometimes, large risks), raise their hand when they’re confused, and try to figure out what’s going on and how a situation could be made better.

When you show up and raise your hand, you’ve already outperformed 90 percent of the crowd.

That’s a really preceptive insight from the 19 year old. I’ve meet plenty of people who have lots of great ideas, but not enough balls to ante, do something about it and the determination to see it through.

If we’re going to change that way of thinking, then we’ve got to start early. That’s one of the core drivers of the Summer of Code ie. show that there are options outside of the cubical farms of the big consulting companies. On the Summer of Code you’ll get paid to experience the life in a start-up and hopefully think of your own ideas to cook up.

Mapping it right

Tuesday, July 3rd, 2007

While I may be a fan of the “intuitive” and “idiosyncratic” nature of neogeography, we all recognise the importance of getting the core geographic information right. We’re about to start a comprehensive update of all our mapping tiles, and while we were able to get out a relatively quick fix for the Wellington bypass, it will take a bit of effort to do it properly for the whole country.

While we pay good money for our base data, it’s a fact of life that nothing’s perfect, and the physical world sometimes moves too fast for surveyors, councils and data providers to keep up with. We already have a list of updates and corrections that we’ll probably have to make manually, and we’ve had useful reports from ZoomIn users that we’ve added to the list. But we want to ask you, our blog readers, whether you’ve noticed any errors, out-of-date areas or places that could do with a tweak.

Along with that, I’d like to know if there are any improvements we could make to the appearance of our maps. As just one example, as a supporter of pedestrian-friendly cities it has always seemed odd to me that pedestrian streets like Cuba Mall have the same symbology as dirt tracks through the bush. There’s a field in the raw data that distinguishes “malls” from walkways, and if I get the chance I’d like to represent the difference visually. Are there any visual quirks or infelicities that you’d like us to take a look at?

We can’t guarantee that we’ll get every suggestion into the upcoming map release, but we’re keen to get your feedback on what would make our maps the best they can be.

Neogeography

Monday, July 2nd, 2007

Here‘s an interesting definition:

Neogeography, as we see it, is a diverse set of practices that operate outside, or alongside, or in the manner of, the practices of professional geographers. Rather than making claims on scientific standards, methodologies of neogeography tend towards the intuitive, expressive, personal, absurd, and or artistic, but may just be idiosyncratic applications of “real” geographic techniques .

That resonates quite nicely with what we’re doing at ProjectX, especially with the community features of ZoomIn and some of the new features that we’re coming up with now. With my “urbanist hat” on, it reinforces for me the idea that a “place” is more than just a “space” or a set of coordinates: it’s about experience, memory and community.


http://www.canakkaleruhu.org http://www.vergimevzuati.org http://www.finansaldenetci.com http://www.securityweb.org http://www.siyamiozkan.org http://www.fatmaozkan.com http://www.sgk.biz.tr http://www.denetci.gen.tr http://www.bagimsizdenetim.biz.tr http://www.mevzuat.biz.tr http://www.security.biz.tr http://www.sorgulatr.com http://www.kanunlar.biz http://www.prsorgu.net http://www.sirabul.com http://www.emekliol.org http://www.coklupagerank.com http://www.coklupagerank.net http://www.coklupagerank.org http://www.prsorgu.org http://www.scriptencode.com http://www.sirabul.net http://www.sirabul.org http://www.sitenizanaliz.com http://www.seoisko.com http://www.seomavi.com http://www.scriptencode.net http://www.scriptencode.org