Three in one
One of the things that we’re always trying to do with data visualisation is show more variables, while trying at the same time not to clutter the map and overwhelm the viewer. When trying to show more than one variable across a map, it rapidly becomes impossible to grasp the information in one go. Edward Tufte, on page 153 of his classic book “The Visual Display of Quantitative Information”, describes one such attempt to map two variables through interaction of two colour schemes as “a puzzle graphic”, “experienced verbally, not visually”.
But that doesn’t mean that it’s not worth the effort. The distribution and interaction of two variables across a region is inherently complex, and to expect every nuance to immediately leap out at a viewer without reflection and complex analysis is unrealistic. My experience of reading professional weather maps that show multiple overlapping contours (e.g. of pressure and temperature) leads me to believe that any multivariate geographical visualisation will require some practice to get the most out of: to learn that where the isobars and isotherms are perpendicular, thermal advection is occurring.
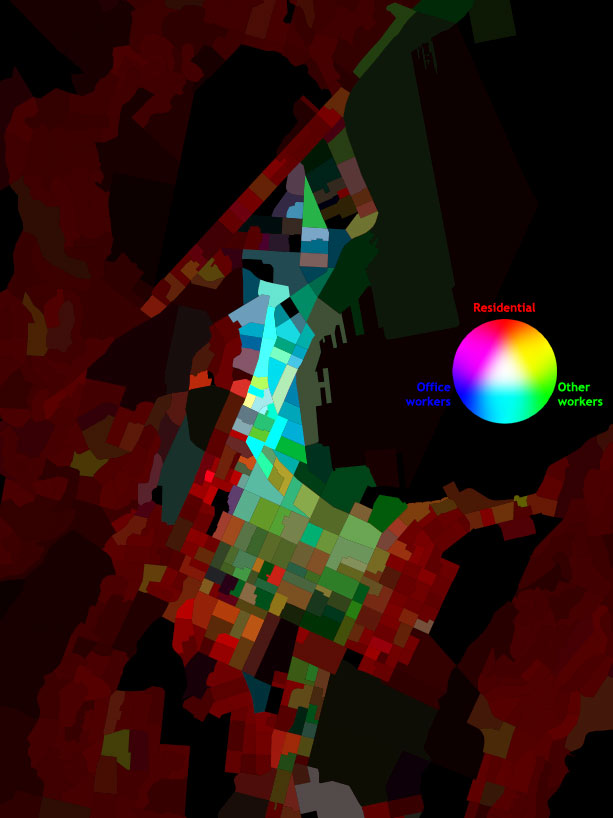
If two variables are too much for Tufte, then the map below would appal him: I’m experimenting with showing three census variables at once on a map of central Wellington. I’ve mapped residential population density to the red channel, density of office workers to the blue channel, and density of other workers (e.g. manufacturing, retail) to green.
It’s certainly complicated! But nevertheless, certain patterns do immediately leap out, and the more I look, the more I see. Purely residential neighbourhoods are quite distinctive in shades of pure red, and variations of population density can be seen quite clearly. The CBD stands out very plainly, but on second glance there’s also a difference between the Lambton Quarter and Thorndon: the cyans of the former show that office workers are balanced by others (probably retail), whereas the latter is much more of an office ghetto. Te Aro is quite a patchwork of greens and earthy tones, showing that a growing residential population is starting to complement the retail, entertainment and tradition light industrial uses of that part of town.
So, while bearing in mind Tufte’s warnings, I think that this sort of trivariate thematic mapping might have a lot to offer. In particular:
- High data density: three separate variables across densely measured meshblocks.
- Emergent patterns: without having to explicitly code “mixed use districts” or “CBDs”, they emerge from the interaction of two or more variables.
- A meaningful grid: census meshblocks are mostly based upon city blocks, so variations in urban form, such as the grid pattern of Te Aro versus the curvy hill suburbs, are easily visible. The familiar forms (at least to locals!) of the wharves guide the eye without explicit use of contextual layers.
- Exploiting human visual processes. While I’d concede Tufte’s point that one has to consciously remind oneself of what certain colours mean, the fact that the RGB system has a neural reality makes it easier than a more arbitrary system would have done.
- Metaphorical power: I deliberately chose to make light colours represent high density and black represent an absence of people, which is the inverse of the usual approach. That gives a map full of neon colours, evocative of “city lights”, and fits with my own preference for dense and vibrant cities. It also brings to mind a mosaic, with its connotations of colourful diversity. As always, symbology reveals ideology!
- Visual appeal. Well, at least I like to think it looks good! While it wasn’t deliberate or expected, I think it’s ended up quite reminiscent of early Paul Klee.
- Depth of exploration. While the two previous points may seem relatively trivial, a map that is attractive and evocative is more likely to bring people back to explore further than an ugly or dull map would. Every time I look, I keep finding more patterns and intriguing anomalies, and it keeps raising new questions to ask of the data.

July 6th, 2007 at 1:52 am
Beautiful image Tom.
I noticed while looking for a vermillion-ish colour in the key, that the key should probably use more smoothed colours – perhaps a triangle with linear interpolation (barycentric interpolation) of colours between the vertices.
Would be interesting to see this map on top of a street layer as well!
nik
July 6th, 2007 at 10:24 am
Thanks. The key was really quickly thrown together in Photoshop (three ramps, at 120 degrees to one another, in screen mode), so it’s far from ideal!
The meshblock boundaries generally follow streets, so with a bit of labelling they could double as a street layer. Maybe I’m just overfamiliar with Wellington after staring at meshblock maps for so long!