Your website as a graph
(This really should be your webpage as a graph. See below)
Just read an amazing post of a bunch of different data visualisation techniques and I spotted this one to visualise your website as a graph.
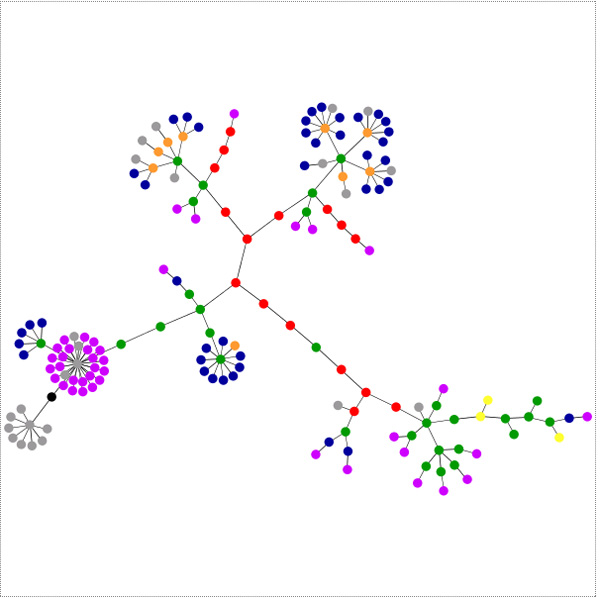
So I did a couple, here is ZoomIn

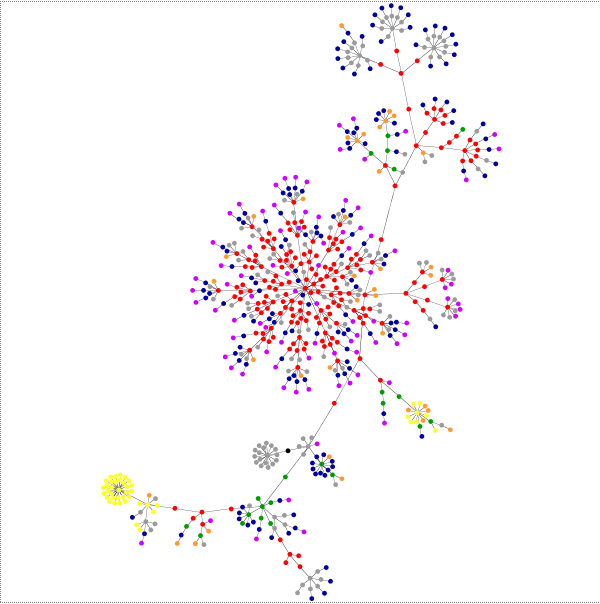
And here is Trade Me.

As you can see the trade me tree is a lot more dense!
You can build your own tree, visit the website as graph site and make your own !
What do the colors mean?
blue: for links (the A tag)
red: for tables (TABLE, TR and TD tags)
green: for the DIV tag
violet: for images (the IMG tag)
yellow: for forms (FORM, INPUT, TEXTAREA, SELECT and OPTION tags)
orange: for linebreaks and blockquotes (BR, P, and BLOCKQUOTE tags)
black: the HTML tag, the root node
gray: all other tags
August 3rd, 2007 at 3:34 pm
The Trademe one is nice, but check this freaky one out I built from the online phonebook at Waikato Uni, looks very organic dont ya reckon?…
http://www.flickr.com/photos/deeknow/157592973/
August 4th, 2007 at 11:19 am
Wow, that’s freaky.
August 10th, 2007 at 8:13 pm
What I’ve wanted for several years, actually more like since before 2000 is a real-time visualisation like this. It is ~hard to show people tracking through a site, but it would be really cool to see the current hot points, hot links, and be able to swing it around in 3D to really zoom in (ahem) on the people moving from place to place within the site.
And then you make it take feeds from many sites with inter-links, and blow your minds…
Jutta Degener (outdated site http://www.cs.tu-berlin.de/~jutta/index.html) was doing this sort of visualisation a long time ago. Those nasty little graphs on the front page are built from traffic logs, I forget what the size and colours indicate but one of them is popularity.
This must be one of the next steps beyond google analytics type stuff.
June 10th, 2008 at 7:15 pm
[…] while back I created a picture of ZoomIn as a graph. I wondered if its changed . Here’s the ZoomIn graph […]