Awesome geo-visualisations from New York Times
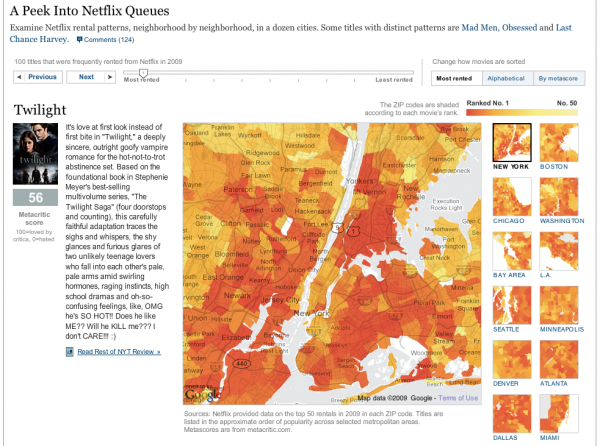
Geo-visualisation and visualisation is becoming more main-stream with media publications creating more and more great visualisations. The New York times have been releasing a constant stream of great geo visualisations, they even have their own visualisation lab on the NYT site. (I’ve also notice that the Guardian has their own http://www.guardian.co.uk/news/datablog also.) Last week the NY Times released an interactive mashup featuring the popularity of Netflix rental across several cities in US.
Using the mashup, you change look change the titles and see the rental popularity of the movie across different zipcodes. Its a great mashup to bring interactivity to data.
I discovered that buy levitra online one of the authors Matthew Bloch has a blog page with all list of the visualisation he’s created for NY Times. Wow, what a great selection of visualisations!
Here’s a sample of my favourite visualisations.

2008 Election results – Obama vs McCain
Hopefully, as data is becoming more open, we’ll see more Geo-visualisations in New Zealand.


